7) Troubleshoot!
The story even further
- After an hour or so, the support center starts a priority conference call.
- They report that customers are receiving payment success messages but transactions don’t post.
- Someone suggests that the network must be down. The network team is paged, searches for an hour, and finds no issue.
- The network team suggests last time this happened their might have been a database error.
- The database team is paged.
- Hours pass and more teams are called.

Enter Dynatrace
Just kidding. That didn’t happen.

With Dynatrace, any problem in the enterprise affecting users is automatically analyzed and the Davis AI provides root cause.
- Open the Problems Pane in Dynatrace, or click the exclamation point at top right.
- Click on the “failure rate increase” problem.
You’ll see start and end time of the problem, user impact analysis, and the root cause of the problem.
- Click on the failing service in red.
With Dynatrace, you’ll see critical context in black/blue and the reason for the alert in red.
-
Quick aside: Dynatrace shows the python services and databases in blue. Dynatrace automatically checked all of the network traffic and databases on the way to providing you root cause.
-
Click on Failure rate to see a view of service performance with the problem area highlighted.
-
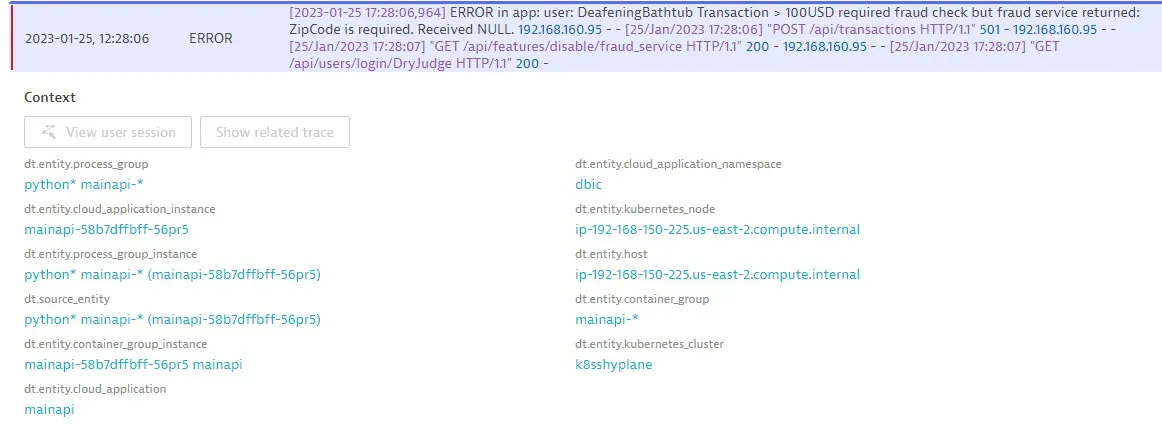
Click Analyze failure rate degradation to see root-cause error message, faulty service, and automatic integration with relevant logs.

With Dynatrace you have immediate full visibility front to back.
- Disable the fraud service. On the end of the base URL, add:
/api/api/features/disable/fraud_service- Review the transactionAPI for decrease in failures. After a few minutes without user users, Dynatrace will automatically close the ticket.
Companies using this today

