5) Explore: Dynabank
In this section we’ll look at the front to back visibility provided by Dynatrace immediately after deployment.
We’ll also share a few highlights of user-configurable options available. Any of them could be automated.
A) Smartscape
- In your Dynatrace tenant, select the “Smartscape” option from the menu. You’ll see that Dynatrace has already generated a topology view.
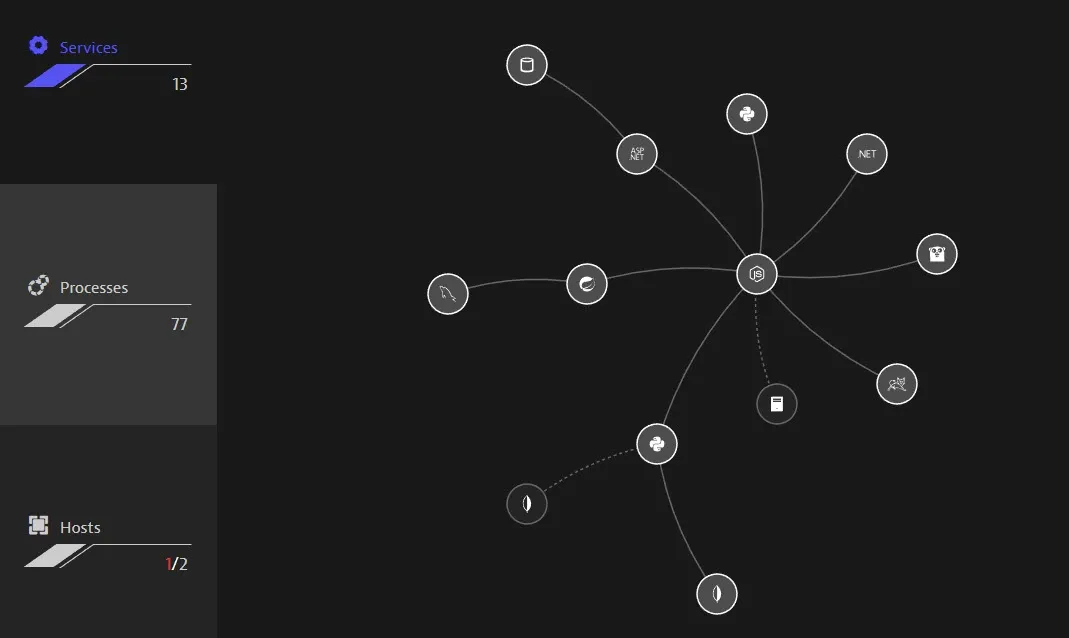
- Click any components in Dynatrace to show the automatically tracked vertical relationships for that entity.

This visibility is unparalled when planning to move applications to another data center or cloud; All dependencies are clearly visible.
B) Services View

- Select “Services” on the left menu. Dynatrace shows all detected services and key metrics for each.
- Select the “OrdersAPI” service to see a dashboard and further drilldowns for it:
- The top left block shows what calls this service, what this service depends on, and where it’s running
- Bottom left shows service KPI’s like failure rate & throughput
- Dynatrace always keeps everything connected. The right side shows ways to view the service flow, back up the chain, and individual traces
Dynatrace workshops versus real deployment or evaluations
While Dynatrace will immediately evaluate every transaction, it builds data and context about the environment for a few hours prior to automatically raising problem cards.
- To avoid 6 hour workshops, return to the services screen & click the “flask mainapi” service.

- In the service, click the more button ”…”, then “settings”.
- Select “Anomaly Detection”.
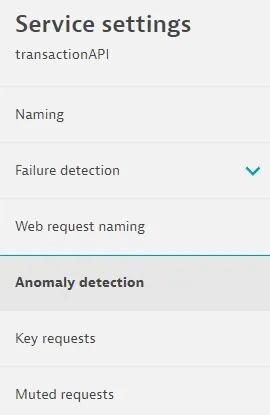
- Under failure rate switch from automatic detection to “Using fixed thresholds” & set a threshold of “5”%.
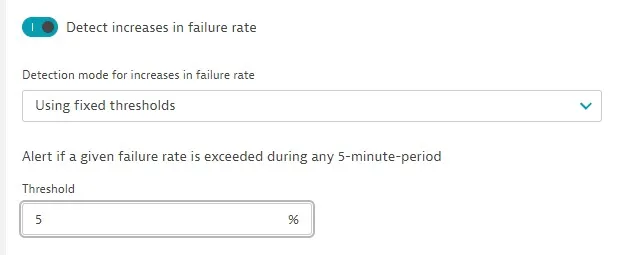
- Make sure to save!

C) Kubernetes View
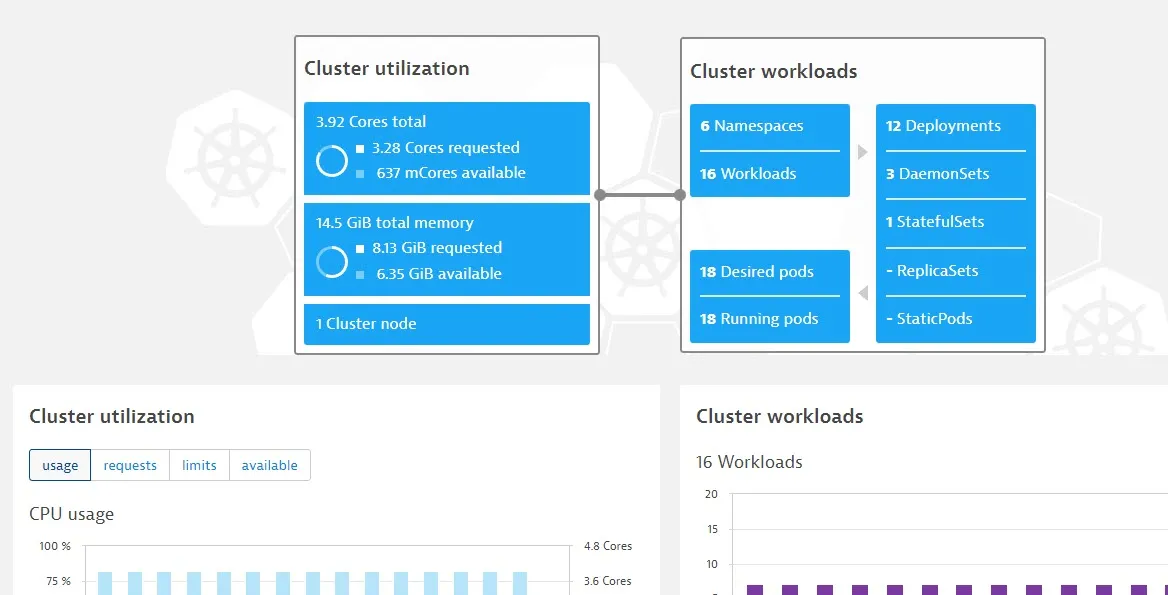
- Select “Kubernetes” from the left menu (under ), then click on the cluster matching your id.
You’ll see a cluster overview, namespaces, workloads, and the option to turn on cluster events.
-
Try clicking on the “dbic” namespace on the lower right to see infrastructure metrics.
-
From here, check out the services running and click ordersAPI.
-
On this page, you can see Dynatrace automatically building visibility up to the services provided & down into the infrastructure.
D) Databases View
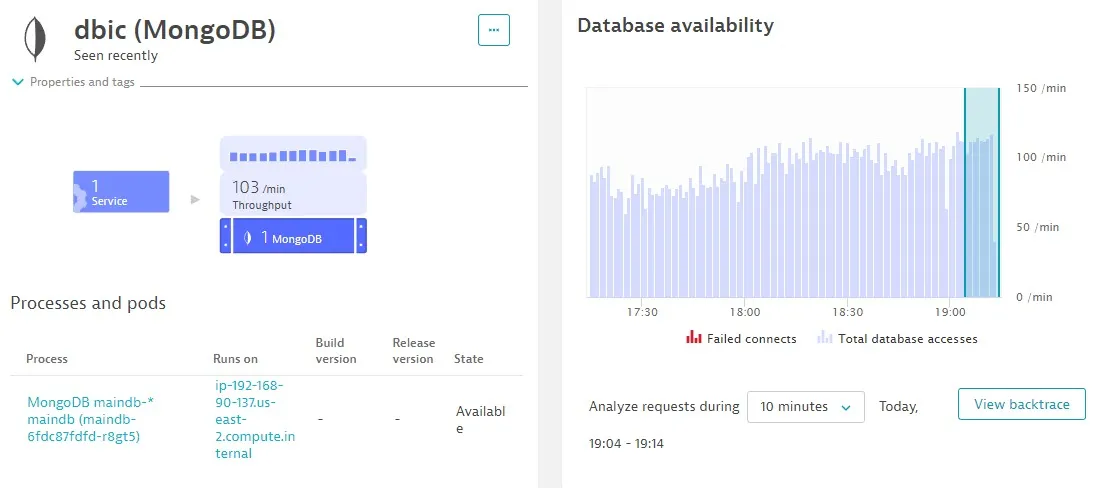
- Select “Databases” on the left menu, then “dbic”. Similar to services, Dynatrace constantly tracks service dependencies, and underlying infrastructure at all times.
- Database calls from any source are shown here with the ability to reverse back up the chain with the “view backtrace” button.
E) Logs
Feature Hightlight: full log integration
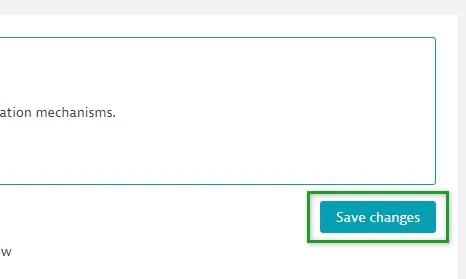
- In Settings -> Log Monitoring -> Log sources and storage, check the box for the host to enable log integration.

- Make sure to save changes!
- Hang tight for a couple of minutes.
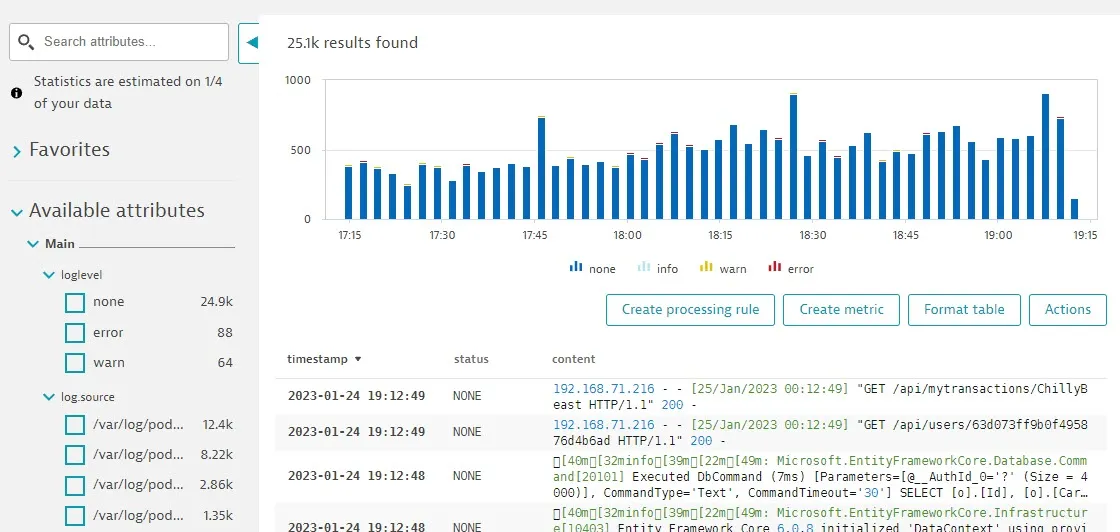
- Select “Logs” on the left menu.
- Select from log types, messages, and sources in “available attributes”.
F) Application View

- Select “Frontend” on the left menu (under “Applications & Microservices”)
- Select “My Web Application”
- Select “1 service” in the lower right of top box.

- Select “view service flow” to show this applications ecosystem front to back.
Feature Highlight: Session Replay
- Return to the main application page.
- Edit the application with the more button ”…” top right.
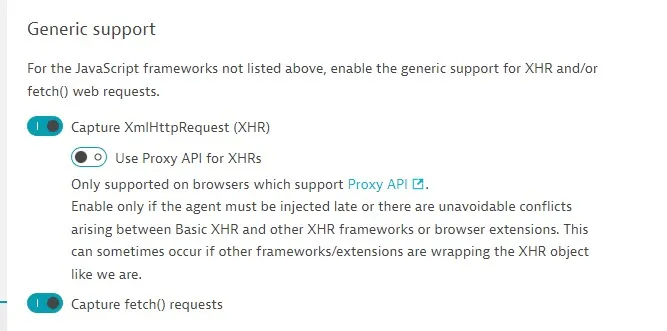
- In Capturing -> Async web requests and SPAs, enable both options under “Generic Support”.
- Enable Session Replay from the “enablement and cost control” page (under “General Settings”).
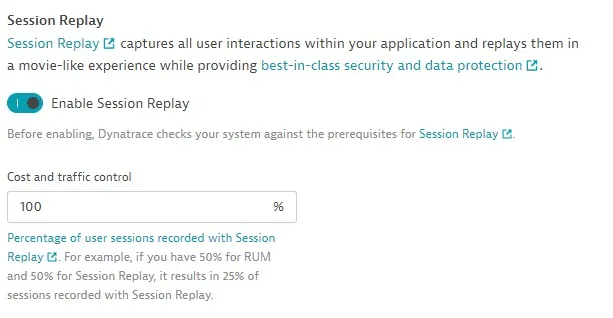
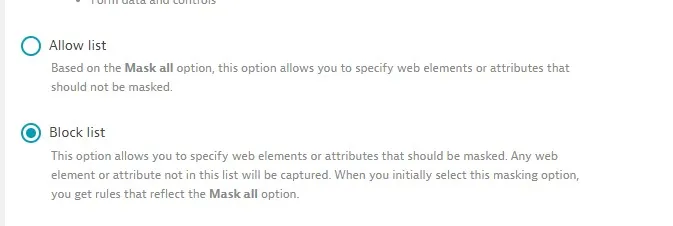
- (Optional!) In the “Data Privacy” -> “Session Replay” section, select the “Recording” and then “Block List.” Do the same for “Playback”.
- (Optional!) Dynatrace defaults to high security settings. You can unblock all items to see everything in the replay today.
- Make sure to save!

Section Complete!
Congratulations, you’ve successfully explored your application in Dynatrace!
- Update the Workshop Tracker.
